
Much is made of how sports franchises use data to find the right players for their teams. Billy Beane famously utilized ‘Moneyball’ to transform the Oakland Athletics baseball team from also-rans to contenders. The A’s didn’t win the World Series under Beane’s stewardship, but they consistently outperformed their budget. The Moneyball model is now followed by a huge array of sports teams across various sports. The use of data in this manner is so famous now that virtually every fan is aware of it.
This is NOT the case concerning the use of data to generate revenue. Yet it makes complete sense. Franchises need a significant degree of revenue to complete at a high level. A growing number of sports organizations are using Tableau to streamline operations, engage fans, and generate revenue. In this piece, we look into the use of Tableau for this purpose. This includes a case study into how the Texas Rangers baseball team has utilized the data visualization software.
Table of Contents
- How Professional Sports Franchises Make Money
- Case Study – The Texas Rangers
- Here’s How Sports Teams Can Use Tableau to Drive Sales
- Conclusion
How Professional Sports Franchises Make Money
The National Football League is by far the most successful sports league in American history. Today, it is a trade association comprised of 32 members. These franchises are individually owned, barring the Green Bay Packers, who remain a publicly owned, non-profit corporation. The NFL’s private status makes it challenging to calculate its actual earnings. However, best estimates (from Bloomberg) suggest it earned $15 billion in 2018. This is an increase on its apparent $13.3 billion revenue in 2016. The NFL’s business model divides revenue streams into ‘National’ and ‘Local’ revenue. In 2018, the NFL earned $8.1 billion in national revenue. Therefore, each franchise received $255 million in national revenue from the league.
Local revenue, on the other hand, differs according to each team. The Green Bay Packers, for example, earned $196 million in this manner. It equated to 43% of its overall earnings for the year. Now, consider the fact that Green Bay had an operating income of just $38.5 million. This is because the organization spent $420 million on stadium upkeep, wages, marketing, and team and administrative costs. In contrast, the Dallas Cowboys, the richest team in the NFL, had an operating income of $365 million!
Here are the different revenue-generating vehicles for NFL teams:
- TV Deals: These comprise around half of a team’s income.
- Merchandising & Licensing: This makes up approximately 10% of a team’s income.
- Ticket Sales & Concessions: Accounts for perhaps 7% of revenue.
- Corporate Sponsors: Varies according to the team.
- Gambling: In May 2018, the Supreme Court ruled that individual states can decide whether to allow sports betting. The NFL will surely jump on gambling as a form of revenue.
For teams looking to squeeze out every last dollar, using Tableau to help with merchandising, ticket sales, marketing, and concessions, makes sense. The Texas Rangers are a prime example of how to do it right.
Case Study – The Texas Rangers in Major League Baseball
Arlington is the home of the Texas Rangers’ Globe Life Park. It is among the world’s largest baseball stadiums with a capacity of 49,115. Making sure the place is full for every home game is a challenge unique to Major League Baseball (MLB). In the NFL, there are just eight home games in a regular season. The NBA has 41 regular-season home games, but stadium capacity is usually in the 20,000-25,000 range. The Rangers have to try and sell out 81 home games a season!
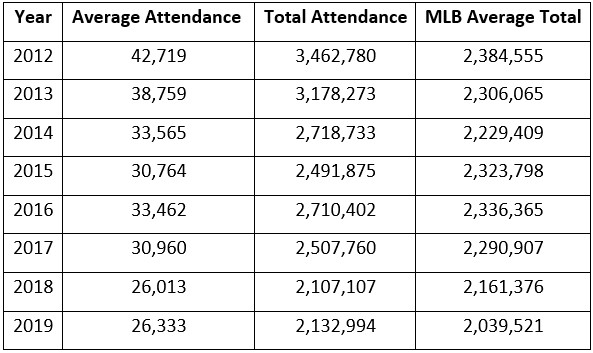
The franchise began using Tableau to track real-time ticket purchases. It also uses the software to track sales or merchandise and food & beverages. The Rangers have seen a steady decline in attendance since a peak season total of 3.46 million in 2012 as you will see in this table:
Four Ways the Texas Rangers Used Tableau to Boost Sales & Revenue
- Real-Time Ticket Sales Data: The Rangers’ staff used Tableau to bring several data sources together into a single view. The front-office team created a dedicated ‘Analytics Task Force.’ The team ensured that employees in different departments were able to access data and share dashboards.
- Ticket Specials: The Texas Rangers launched a special four days before a Father’s Day game and could track the real-time performance. The franchise also used Tableau to discover that approximately half of the individual ticket sales occur in the 10 days before the game, including on the day of the event.
- Staffing: The staff of the Rangers used Tableau to understand how rain delays affected sales. The team discovered that there wasn’t a single ticket sale for 15 minutes after rain delayed a game. As a result, the Rangers decided to shut down three-quarters of its box-office windows.
- Promotions: The team believed that the highest sales for ‘bobblehead’ nights occurred on Friday, Saturday, or Sunday. They were shocked to learn that Tuesday was the best seller! The Rangers added an extra bobblehead night on a Tuesday night game at the end of a month. The result was an increase in ticket sales.
Here’s How Sports Teams Can Use Tableau to Drive Sales
The efforts of the Texas Rangers is just one example of how sports franchises use Tableau. Here is a simple overview of what they can use Tableau to do.
- Visualization of Ticket Sale Trends: With Tableau, it is possible to visualize the data and quickly see relevant trends. Through this process, you can make rapid changes and increase revenue. Without access to this real-time data, you’ll have to wait until the end of the season and lose precious income.
- Understand What Your Fans Want: Yes, they want their team to win, but they also want to have an enjoyable experience. With Tableau, you can easily analyze data such as finding out how many people leave before the end or the promotions that work best.
- Increase Concessions Stand Revenue: Part of the customer experience is the standard and availability of refreshments from the concessions stands. Use Tableau to analyze your data and determine if the food and drinks are priced accordingly, the most popular menu items, and peak purchasing times.
- Sell More Merchandise: Use Tableau to check out the revenue from previous games, the highest selling items, the most popular players, and the price ranges that yield the best returns.
Tableau & Behind the Scenes Profits for Sports Teams – Conclusion
Collecting data is one thing; having the ability to use it to your advantage is another thing entirely. It is entirely possible to get confused with a huge array of data on your plate. There is also the risk of ‘paralysis by analysis.’ Fortunately, Tableau enables you to gather the data and see the precise numbers behind everything. It allows your company to bring different departments together and find a way to collaborate to the organization’s benefit.
Sports teams like the Texas Rangers enjoy the positive revenue-generating results experienced on their Tableau journey so far. The software can help with ticket sales, concessions, merchandising, and even staffing costs. At Thinklytics, we are expert consultants for the Tableau platform. We make it easy for companies of all sizes to discover what the numbers really mean. With the ability to react quickly with the aid of real-time data, you can make rapid decisions to boost company income. Furthermore, you can enjoy long-term benefits as we help implement the structural and even organizational changes your company needs to make it to the next level.
If you’re interested in learning more, schedule your free 60-minute consultation.
Curious to know more? Schedule a consultation with Thinklytics to know more about how data analytics can make your life easier and make you a hero at work.