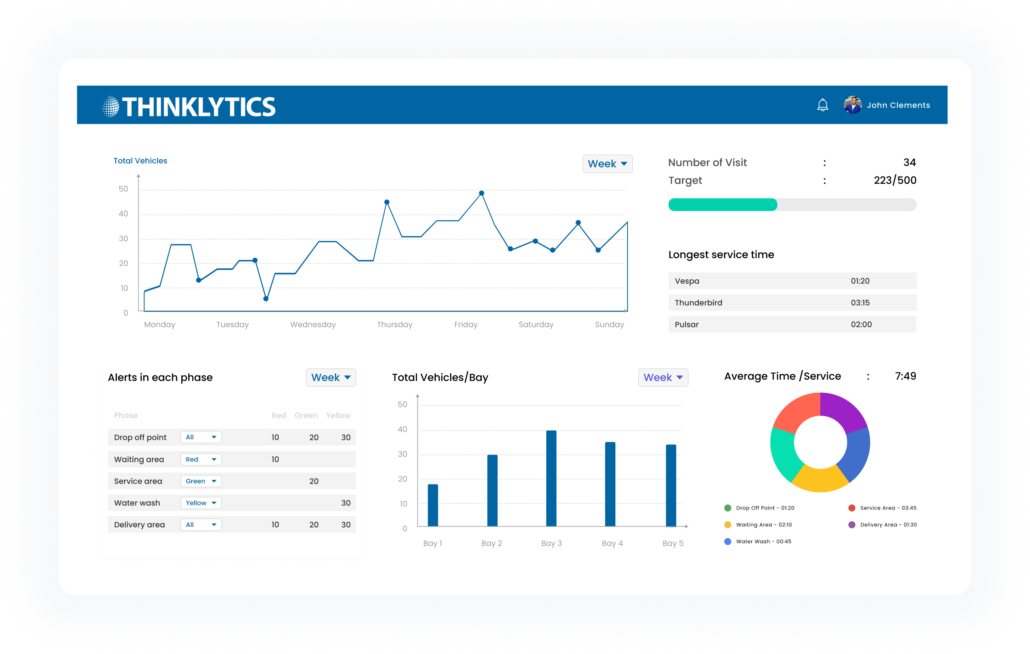
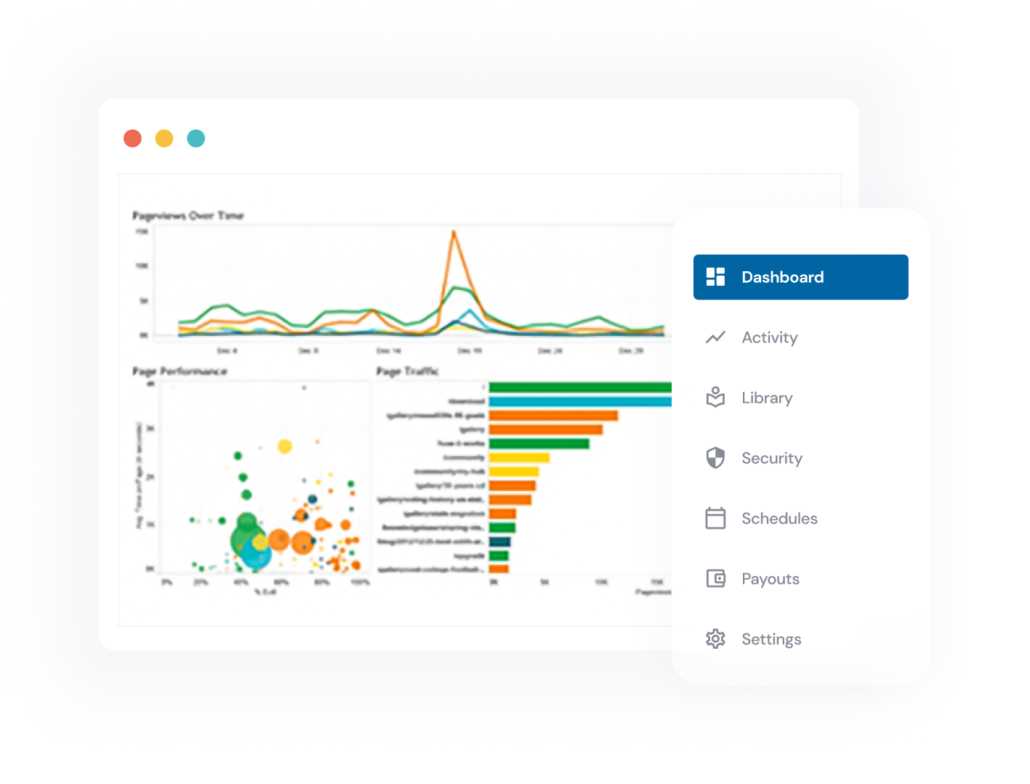
Drive Growth and Make Informed Decisions with Our Business Intelligence and Analytics Services

Analytics services

We have the tools to help you make informed decisions about your business.

Our Business Intelligence and Analytics Services will give you the power to drive growth, no matter what stage of your business.

BI Dashboard

If you’re a business owner, you know how important it is to make informed decisions. But how can you make sure that your data is accurate and complete? And how can you be sure that the information you’re using to inform those decisions is reliable?

We’ve got the answer—and it’s not what you think. We work with our clients to create data visualizations that tell the whole story behind their numbers so that they can get a clear picture of their business and where they need to go next. We’re not just drawing pretty pictures; we’re helping our clients make sense of their data so they can use it to make better business decisions.

How Does Our Data Visualization Solution Work?

As a business, making sense of the vast amounts of data you gather is essential for productivity. With Thinklytics, you can visualize this data with stunning dashboard designs. Our dashboards also allow you to analyze and manage data effortlessly, quickly identifying trends and focusing on crucial issues.

Our visualizations exemplify the saying, “a picture is worth a thousand words.” So whether you’re analyzing reports and spreadsheets or website analytics for millions of visitors, our dashboard designs provide clear and insightful visuals that convey complex data and intuitively.

Data Visualization Solution

At Thinklytics, we take a comprehensive approach to understanding your company’s unique requirements. Our strategy includes customized dashboard design for both Tableau and Power BI. By examining every facet of your business and its components, we can establish strong data governance, increase departmental productivity across locations, and help you leverage your current data assets to their full potential. Whether you’re migrating from Tableau to Power BI or vice versa, our team has the expertise to ensure a smooth and successful transition.

Experience the full potential of your data with Thinklytics’ data visualization services. Get started today!

Our Business Intelligence and Analytics Services

At Thinklytics, we provide comprehensive business intelligence and analytics services to help you harness the power of data and make informed decisions.
database consulting firm

Data Visualization

Create impactful insights with rich visualizations and dashboards.

database consulting firm

Data Strategy & Modeling

Develop comprehensive information strategies that solve business problems.

database consulting firm

Database Architecture

Optimize data infrastructure to improve transferability, readability, and efficacy.

database consulting firm

Information Governance

Straightforward program to collect, store, organize, use, and manage your information.

database consulting firm

Business Intelligence

Implement business intelligence solutions focused on your business objectives.

database consulting firm

Server Install & Support

Relax with our Server installation and monitoring services.

Data Visualization Tools to Unleash the Power of Your Data

The first thing you need to know about data visualization is that it’s for more than just the pros. Everyone should be doing it.

Why? Because data visualization helps you draw connections between different pieces of data, which can lead to new insights and ideas. It also enables you to communicate your findings in a way that’s easy for people to understand.

But how do you get started with data visualization? There are a lot of tools out there—but which ones are best for your needs? Don’t worry! Thinklytics has got your back. 

Ready to unlock the power of your data? Contact Thinklytics for advanced data visualization insights today!

Benefits of Data Visualization Consulting

Data visualizations are the best way to communicate complex information in a simple and easy-to-understand format.

Here are the benefits of data visualization consulting:

Pricing Options for our Data Visualization Services

We want to ensure you have all the information you need to make an informed decision about your data visualization needs.

Our Data Visualization services are priced according to a few different variables:

The type of data being visualized

The complexity of your project's requirements

Your budget

For the exact pricing, contact our experts today!

Transform your data storytelling with one of the leading data visualization companies - Thinklytics. Get in touch with us today!

Maximize Your Data's Potential with Our Innovative Data Modeling Solutions

Maximize Your Data’s Potential with Our Innovative Data Modeling Solutions

Your data is the lifeblood of your business. It powers the decisions you make, and it helps you grow. But sometimes, your data can get messy—or even unusable. That’s why we’re here to help you maximize the potential of your data through our innovative data modeling solutions.

With Thinklytics, you’ll be able to:

Why Choose Thinklytics as Your Trusted Data Visualization Company?

Knowing your data is the key to becoming a successful business, and we are here to help you achieve that goal. Here are some of the reasons why you should choose us:

Comprehensive Approach

Comprehensive Approach

We take on complex problems and produce superior information solutions that are simple to use and intuitive. In addition, we take a comprehensive approach to Tableau and Power BI projects, bringing together our professionals from many business disciplines and industries to address business issues.

Extensive Expertise

Extensive Expertise

We have extensive expertise in delivering Tableau and Power BI data and visualization services and solutions in various verticals and industries. We know how to develop plans, strategies, and tools that have a low impact on your IT infrastructure and provide a high return on investment.

Assisting You All The Way

Assisting You All The Way

We help businesses of all levels and backgrounds maximize the potential of Tableau and Power BI. We specialize in creating custom solutions tailored to your unique business needs. These customizations mean you'll have access to the right metrics and KPIs to measure success and drive results, no matter where you are in your data journey.

If you're interested in moving your Tableau environment to the cloud, we can also help with that. Our cloud migration services for Tableau make it easy to take advantage of the benefits of cloud computing, such as increased security, accessibility, and scalability.

Frequently Asked Questions

Data visualization consulting is a service provided by data visualization experts who help you understand and communicate your data to others.

Data visualization consultants can help you make sense of your data so that you can make decisions based on it.

Data visualization consultants provide a variety of services. The most common is data visualization creation, maintenance, and upkeep. These services can include any visualization requiring a consultant’s expertise, including graphs, charts, maps, or other visual representations.

Data visualization consultants work with clients to understand their data needs by getting a clear picture of what the client wants, what they are doing now, and what they hope to achieve. They ask questions like “What is your goal? What do you want to accomplish?” and “What kinds of charts do you want?”

Once the consultant has all the necessary information, they visualize the data in meaningful forms for the client. For example, if a client only wants pie charts, that is what they will get. But if the client wants something more complex or specific, the consultant can create it for them, such as building KPI in Tableau. Our team has extensive experience in designing and implementing custom KPIs in Tableau, ensuring that you have the right metrics to measure the success of your business. We specialize in creating KPIs tailored to your business needs and providing actionable insights that drive business results.

The skills required for a data visualization consultant are:

  1. A solid understanding of how to structure and interpret data from different sources
  2. A thorough knowledge of how to use the tools necessary to transform that data into compelling visualizations
  3. An ability to translate the data into forms that are understandable and meaningful to non-experts

The length of a typical data visualization consulting engagement depends on the project’s scope. We can provide you with a brief scope of work, so you can get an idea of how long it will take.

Pricing can vary greatly depending on the size of your business, the complexity of your information, and how many consultants you need to complete your project.

Choosing a data visualization consultant is a great way to help your company become more efficient and effective.

First, you should ask yourself what your needs are. Are you looking for someone to help you understand your available data? Do you need help creating new visualizations from scratch? Or do you want someone to guide you on improving existing ones?

Next, consider what kind of experience level you’d like from your consultant. For example, are they more experienced with data visualization or design work? Will they be able to help you through the entire process or provide advice along the way?

Finally, consider cost and timeframe. How much do these services typically cost? Is there any flexibility in terms of when they’ll be delivered?

Absolutely! Data visualization consulting can help you improve your business decision-making by allowing you to better understand the information you already have and how it relates to what you need.

Data visualization consultants can help you use data more effectively to make better decisions, as well as help you gather the data you need to make those decisions. They can also provide advice on visually displaying that data so that it is straightforward and easy for others who are less familiar with the information to understand.

Testimonials

Josh Armor
My team and I have worked with Thinklytics for over 2 years now, and the impact on our business has been beyond significant! They guide us through the entire process of building an infrastructure for all of our data and now we’re able to use it to make better business decisions! This has been a game-changer in our business!
Samantha Johnson
There is no such thing as too much data for a company! Thinlytics data strategy and modeling strategies have helped us to learn how to use the data from our business in a proactive way. This is business intelligence 2.0!
Antonio Alcocer
My favorite part of working with the Thinklytics team? The visualizations! Our reports now are comprehensive and updated in real time! We’re not missing key data points. We were concerned because our remote team uses different operative systems, but the Thinklytics team made it work flawlessly!

Need Help? Inquire Now