The sports industry has seen a meteoric rise in the use of data analytics to select the best talents, thanks to initiatives like Billy Beane’s ‘Moneyball’ strategy. The Oakland Athletics might not have clinched the World Series title during Beane’s tenure, but they consistently defied financial constraints, making it a true example of successful data-driven decision-making.
It is not, however, just about player selection. Teams are also capitalizing on data to maximize revenue streams. A tool at the forefront of this revolution is Tableau. In this deep dive, we examine how sports organizations, particularly the Texas Rangers, use Tableau to streamline operations, engage fans and boost revenues. And they must be doing something right, as the 2023 World Champions!
Table of Contents
- How Professional Sports Franchises Make Money
- Spotlight: The Texas Rangers’ Success with Tableau
- Strategies: Leveraging Tableau to Drive Sales for Sports Teams
- Conclusion: The Tableau Advantage in Sports
How Professional Sports Franchises Make Money
The NFL is by far America’s most successful sports league. With 32 member franchises that are individually owned (excluding the publicly-owned Green Bay Packers), its financial transactions are mostly private and intricate. Even so, Bloomberg estimated its earnings at a staggering $15 billion in 2018, up from $13.3 billion in 2016.
Revenues are classified into ‘National’ and ‘Local’. In 2018 alone, the NFL amassed $8.1 billion in national revenue, translating to $255 million for each franchise. Meanwhile, local revenues vary; the Packers generated $196 million, accounting for 43% of their total earnings.
Of note, Green Bay had an operating income of only $38.5 million, because they spent $420 million on stadium upkeep, wages, marketing, and team and administrative costs. In contrast, the Dallas Cowboys who are the richest team in the NFL, had an operating income of $365 million. That is a whopping 10x difference.
Breaking down various revenue-generating vehicles further:
- TV Deals: Approximately 50% of a team’s revenue
- Merchandising & Licensing: Close to 10% of revenue
- Ticket Sales & Concessions: Roughly 7% of revenue
- Corporate Sponsors: Varies widely across teams
- Gambling: A potentially large revenue stream since the Supreme Court’s 2018 ruling
For franchises eager to maximize every dollar, leveraging Tableau, especially in merchandising, ticket sales, and concessions, can be a game-changer. Enter the Texas Rangers.
Spotlight: The Texas Rangers’ Success with Tableau
Arlington is the home of the Texas Rangers’ Globe Life Park. It is among the world’s largest baseball stadiums with a capacity of 49,115. Making sure the place is full for every home game is a challenge unique to Major League Baseball (MLB).
In the NFL, there are just eight home games in a regular season and the NBA has 41 regular-season home games. The Rangers have to try to sell out 81 home games each season!
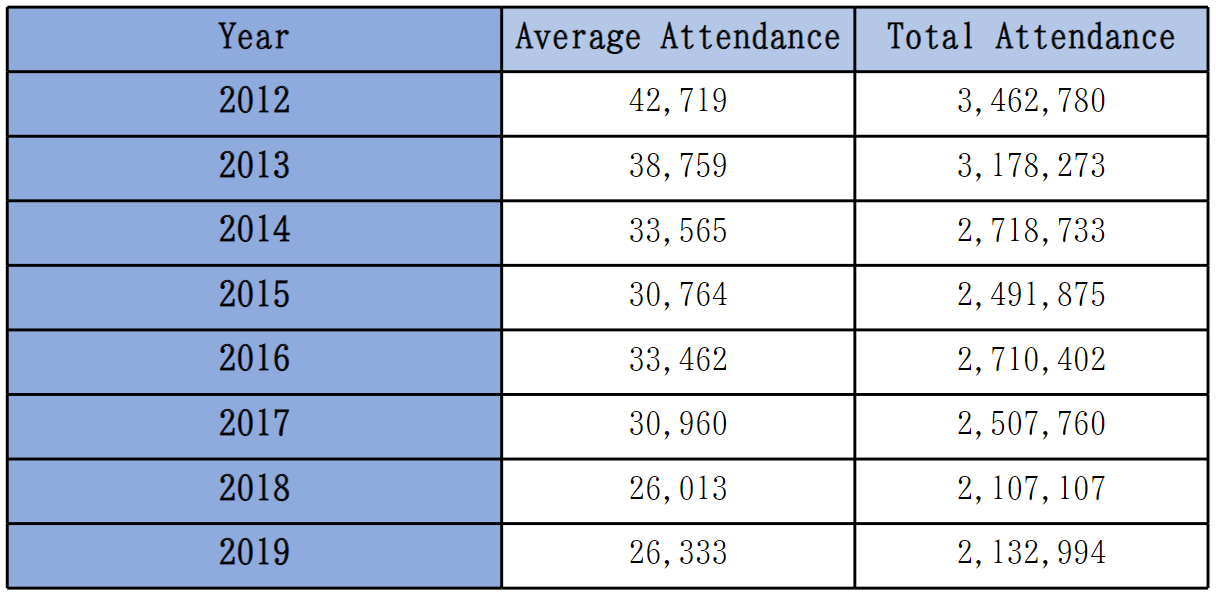
To address this, the Rangers deployed Tableau to monitor real-time ticket sales, merchandise transactions, and food & beverage trends. The results have been enlightening, as demonstrated in the table below, showcasing the declining attendance pattern from 2012-2019. The Rangers had peak attendance in the 2012 season with 3.46 million, and a low attendance in 2018 with 2.1 million. 2019 was only slightly higher at 2.13.
Four Ways the Rangers Used Tableau to Boost Sales & Revenue
Real-Time Ticket Sales Data:
- The Rangers’ staff used Tableau to bring several data sources together into a single view.
- The front-office team created a dedicated ‘Analytics Task Force.’
- The team ensured that employees in different departments were able to access data and share dashboards.
Ticket Specials:
- The Texas Rangers launched a special four days before a Father’s Day game and were able track the real-time performance.
- The franchise also used Tableau to discover that approximately half of the individual ticket sales occur in the 10 days before the game, including on the day of the event.
Staffing:
- The staff of the Rangers used Tableau to understand how rain delays affected sales.
- The team discovered that there wasn’t a single ticket sale for 15 minutes after rain delayed a game.
- As a result, the Rangers decided to shut down three-quarters of its box-office windows.
Promotions:
- The team believed that the highest sales for ‘bobblehead’ nights occurred on Friday, Saturday, or Sunday.
- They were shocked to learn that Tuesday was the best seller!
- The Rangers added an extra bobblehead night on a Tuesday night game at the end of a month.
- The result was an increase in ticket sales.
Ideas for Sports Teams to Leverage Tableau to Drive Sales
Tableau isn’t exclusive to the Rangers. Here are a few ways other sports teams can take advantage of the data and insights:
- Ticket Sale Visualization: Spotting trends becomes effortless with Tableau, allowing swift interventions to boost sales.
- Fan Experience Analytics: Besides victory, fans crave an immersive experience. Determine impactful metrics such as when fans typically leave or which promotions resonate most.
- Concession Stand Optimization: Evaluate food & beverage offerings, price points, and peak purchase times.
- Merchandise Metrics: Gauge past performance, identify top-selling items, and pinpoint the most lucrative price ranges.
Conclusion: The Tableau Advantage in Sports
Data collection is only half the battle; interpreting and utilizing that data is where the real magic happens. The risk? Overwhelming amounts of data leading to decision paralysis. This is where Tableau shines, facilitating comprehensive insights for collaborative, informed decisions.
Franchises like the Texas Rangers have already reaped the benefits, witnessing revenue surges in ticket sales, concessions, merchandise, and even operational savings.
At Thinklytics, we specialize in Tableau consulting. We help organizations, regardless of size, decode their numbers, and equip them with actionable insights. Embrace the power of real-time data to transform your decision-making process.
To take your organization to new heights, book your complimentary 60-minute consultation with us. https://calendly.com/thinklytics-us