
“Throughout our engagement, the team at Thinklytics demonstrated an unwavering commitment to excellence. They were responsive, attentive, and dedicated to delivering the best possible outcomes. Their professionalism and passion for their work were evident in every interaction, and the results have exceeded our expectations. We couldn’t have asked for a better partner in our journey toward data-driven success.”

“Our challenges were multifaceted, involving various departments and processes. Thinklytics approached our situation holistically, considering all aspects of our business. They developed comprehensive solutions that addressed the root causes of our issues, rather than just the symptoms. This thorough approach has led to lasting improvements in our efficiency and productivity.”

“What sets Thinklytics apart is their genuine interest in understanding our unique challenges. They didn’t offer one-size-fits-all solutions but took the time to learn about our industry and specific needs. This personalized approach resulted in solutions that truly resonate with our objectives and have made a significant impact on our operations.”

“Setting up and maintaining servers was a daunting task for our small IT team. Thinklytics took over this responsibility, handling everything from installation to ongoing monitoring. Their team ensured that our servers integrated smoothly with our existing systems. Since they took charge, we’ve experienced enhanced performance and minimal downtime, allowing us to focus more on our core business activities.”

“We operate in a niche market and were concerned about finding a consultant who understood our field. Thinklytics brought a wealth of experience from various industries, providing fresh perspectives that we hadn’t considered. Their diverse expertise enriched our projects and led to innovative solutions that have greatly benefited our business.”

“We had plenty of data but lacked the tools to interpret it meaningfully. Thinklytics introduced us to business intelligence solutions that were perfectly aligned with our goals. They set up systems that analyze our data and present actionable insights. Now, we can anticipate market trends, understand customer behaviors, and make strategic decisions that keep us ahead of the competition.”

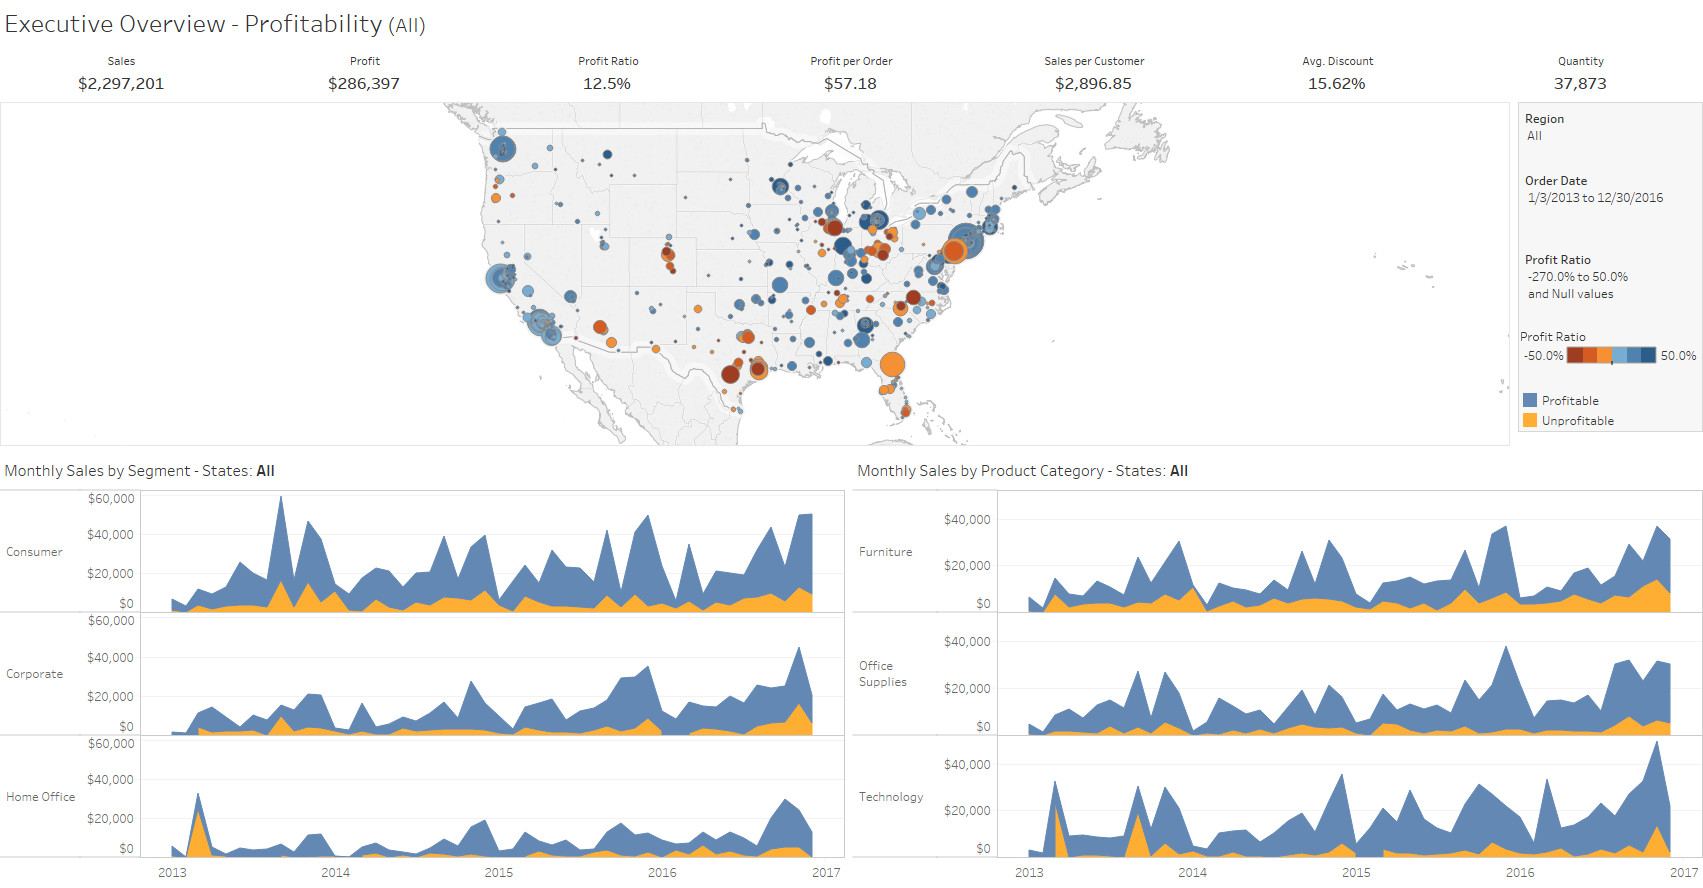
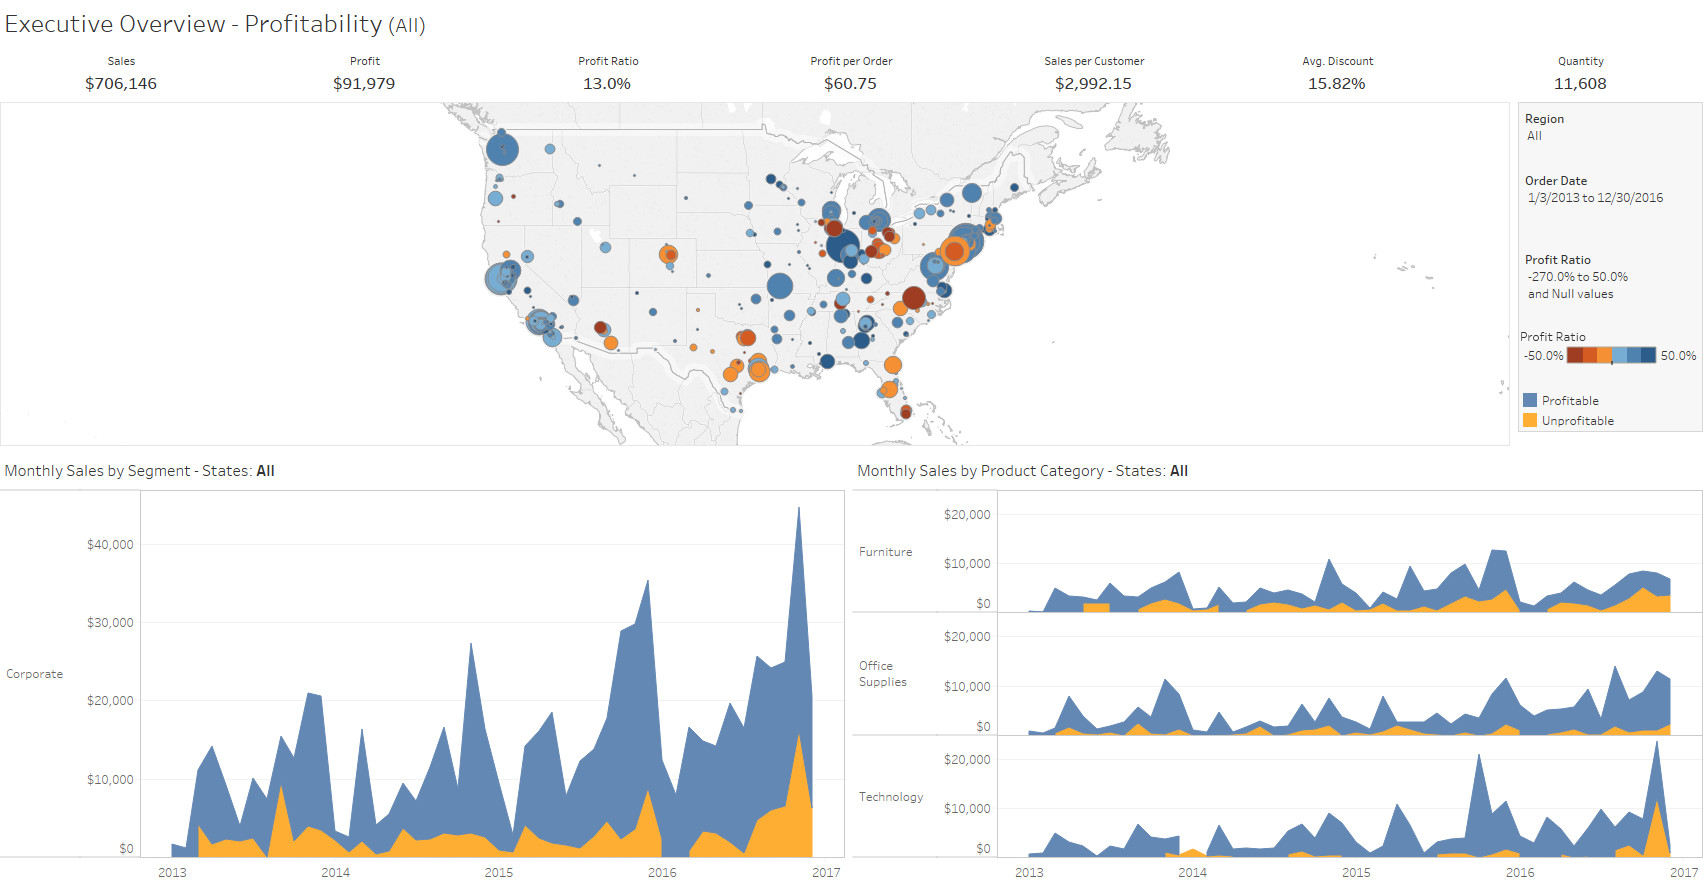
“Our company struggled to make sense of the vast amounts of data we collected daily. Thinklytics stepped in and transformed this overwhelming information into clear and engaging visuals. Their dashboards are not only visually appealing but also intuitive, allowing our team to quickly grasp key insights. This transformation has enabled us to make informed decisions swiftly, leading to improved performance across departments.”

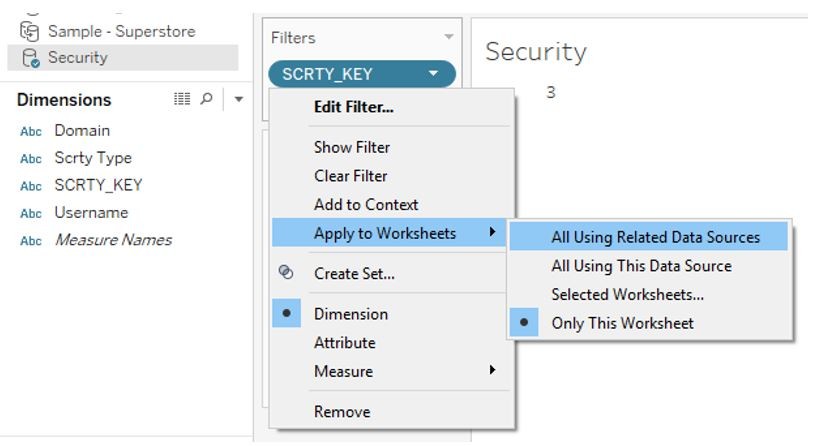
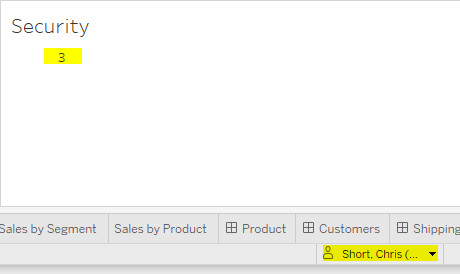
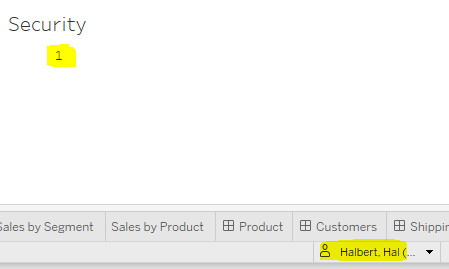
“Handling sensitive information was a major concern for us, especially with increasing regulatory requirements. Thinklytics helped us establish a clear and effective program to manage our data. They provided guidelines on how to collect, store, and use information responsibly. With their assistance, we’ve built trust with our clients, knowing that their data is handled with the utmost care and compliance.”