
Data visualization and analytics is huge business these days. Brands now fully understand the importance of gathering and analyzing data. The information gleaned from this process can cut costs, boost customer engagement, and increase profits. There are dozens of business intelligence tools, but consumers want a combination of ease of use, price, power, and brand recognition. There are few offerings on the market that provide all of the above better than Tableau and Microsoft Power BI. They are considered two of the best options on the market and are often the subject of comparison.
This is precisely what we intend to do today. We compare three key areas to see which option comes out on top:
Features
Tableau
You have the option of taking a 14-day trial where you gain full access immediately. It is possible to begin connecting your data sources as soon as the trial begins. Those who build visualizations in Tableau Desktop can share them with their team via Tableau Online or Tableau Server.
Tableau has access to a vast array of database sources and servers. Other features include:
- Importing data of all ranges and sizes.
- Sharing and embedding dashboards.
- DAX analysis function.
- Data blending.
- Data collaboration & data notifications.
- The ability to create “no-code” data queries.
- A vast product range, including Desktop, Desktop Personal, Desktop Professional, Public, Server, Online, and Reader.
Power BI
There is desktop, mobile, and service options. You may need all of these services to publish your visualizations. The Azure tenant setting is the most basic and involves connection via an Office365 Admin interface. Users can connect spreadsheets, data sources, and apps through built-in connections and APIs.
Other relevant Power BI features include:
- Datasets
- Reports
- Q&A question box
- Trend indicators
- Real-time dashboards
Winner – Tableau
Tableau offers significantly more features than Power BI. It utilizes far more data sources with a vastly superior data capacity. On Power BI, each workspace/group can only handle 10GB of data. You need the data to be in the cloud via Azure to handle more. In contrast, Tableau uses a columnar based structure. It stores only unique values for every column. As a consequence, it can fetch billions of rows.
Ease of Use
Tableau
There is something of a learning curve involved in the use of Tableau. One plus is that you don’t need to use any coding language to create charts and scatter plots. Also, Tableau doesn’t restrict the number of data points you can use. When dealing with large datasets, the system could potentially slow down. It could take some time to get a handle on using Tableau. It requires the user to understand the data they want to look at and why before beginning.
This is necessary to get the most from Tableau’s integrations and connections. Users must identify the data to pull into the tool before making the connection. Some of the features are hidden behind menus, so it may take time to find the relevant ones. However, even though some users say Tableau has a cluttered appearance, it becomes easy to use once you have enough practice. The ability to drag and drop is also extremely useful.
Power BI
The Power BI interface is easy to use and emerged as an add-on to Microsoft Excel. It offers API access and pre-built dashboards. Power BI also has a drag and drop feature, which even novice users find simple to handle. With native apps, it is possible to gather data from anywhere. The natural language query tool is a nice addition.
Winner – Power BI
Overall, Power BI has the edge in user experience, at least in the early stages. It takes longer to get to grips with Tableau. However, this is down to the extra features and functions. There are no datapoint limits with Tableau. In Contrast, Power BI allows a maximum of 3,500. Users must decide if they want to sacrifice greater functionality and more features for simplicity of use.
Value
Tableau
With no limits on data points, Tableau enables users to undergo as sophisticated analysis as they can understand. It recently made changes to its pricing model. Now, it uses a tiered system that looks at connections to files versus third-party apps. You will save money if you have plenty of data on spreadsheets. This is because you can export it from third party tools before uploading to Tableau. Even the lowest cost Tableau option costs more than Power BI, but its advocates say the extra features make it value. With the ability to use 24 different types of data visualization and outstanding customer support, Tableau can justify its extra pricing.
It also offers extensive support tools to help you understand how to use the software. It handles a huge amount of data with better performance than Power BI. According to the Tableau website, customers experienced an ROI increase of almost 600% after using Tableau. It is designed for experienced analysts and large businesses.
Power BI
This product comes at a lower price point, though scaled features and extra users cost more. Companies already invested in Microsoft Software will also benefit from a lower overall price. Power BI doesn’t offer the same depth of data analysis as Tableau and is better suited to SMEs looking to analyze a moderate amount of data. Power BI’s level of customer support doesn’t match up with Tableau. It stores relatively little data outside of the cloud and has limited access to other servers and databases. Also, Power BI’s performance is inferior to its rival when faced with a huge amount of data.
Winner – Tableau
Ultimately, you get what you pay for with Tableau. It costs more, but you receive far more features, better support, and the ability to analyze more data.
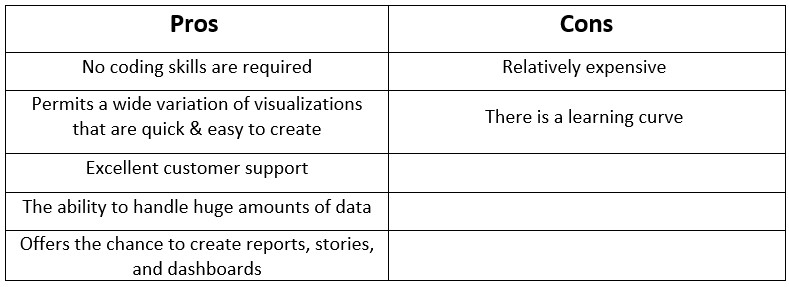
What Are the Pros & Cons of Tableau and Power BI?
Tableau
Power BI
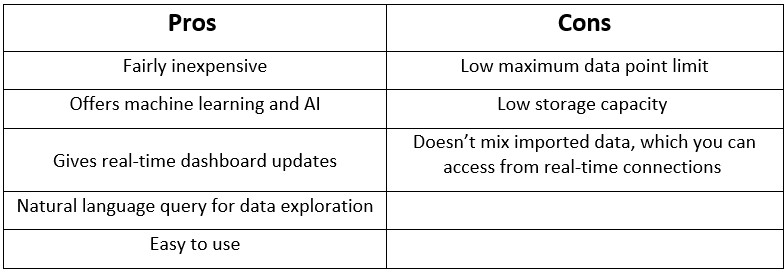
Tableau is Better Than Power BI At:
- Handling large volumes at data with a high level of performance.
- Offering detailed and dedicated customer support.
- Helping you visualize data.
- Assisting large companies and experienced data analysts.
- Boosting a company’s bottom line.
Power BI is Better Than Tableau At:
- Providing affordable data analysis.
- Offering a better initial user experience.
- Keeping things simple.
- Benefiting SMEs.
Thinklytics + Tableau = Increased Productivity & Profit
At Thinklytics, we believe that connected data drives innovation, identifies issues before they become problems, and increases long-term profit. We believe that Tableau is the best data visualization tool on the planet, which is why we specialize in its use. Customers quickly learn to love Tableau, and trust us to get the most out of this remarkable BI tool. If you want to see what the fuss is all about, schedule a FREE 1-hour consultation with us today.
Curious to know more? Schedule a consultation with Thinklytics to know more about how data analytics can make your life easier and make you a hero at work.