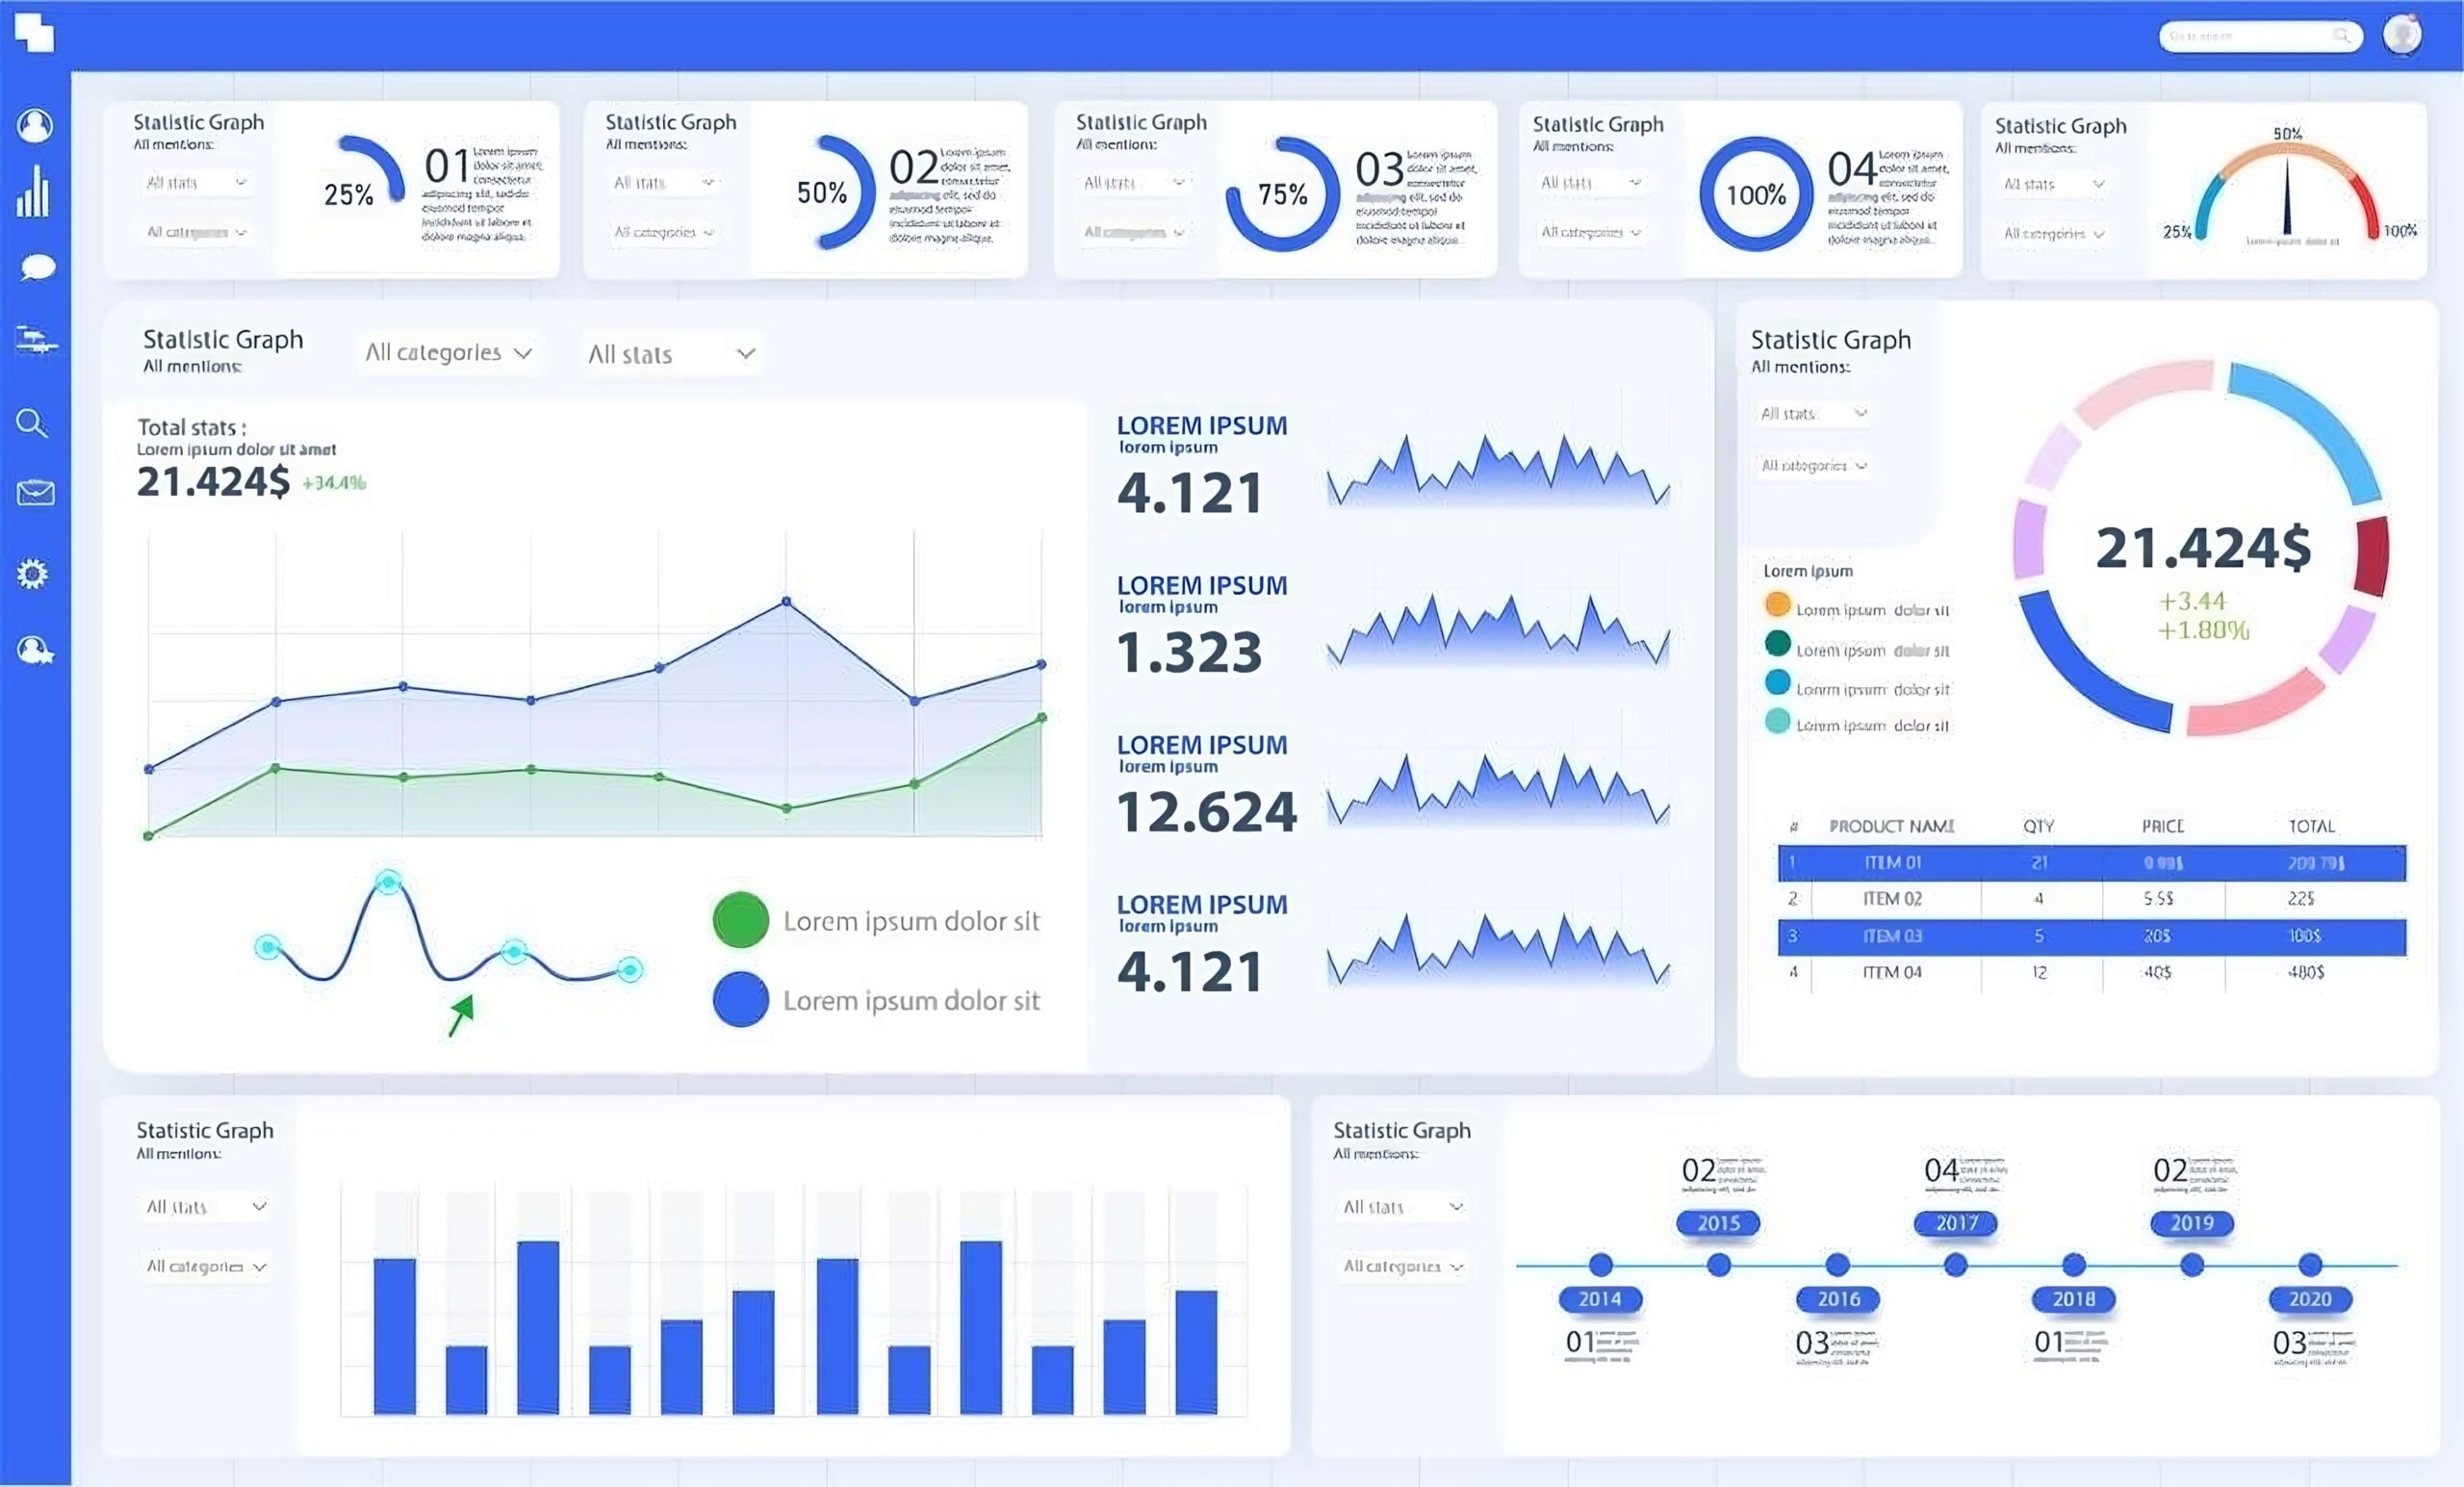
In today’s rapidly evolving business environment, the choice between Business Intelligence (BI) systems like Tableau and PowerBI depends on several factors including industry specifics, managerial expertise, user demands, and the audience who will use the data. The key to deploying the best system for you is finding a BI tool that seamlessly aligns with your organization’s unique challenges and objectives.
For a business to be truly customer-centric, the ability to act quickly on data insights and offer personalized experiences is crucial. As well, companies are continually expected to do more with less, so executives who rely on accurate KPIs and data-driven insights are better able to steer the ship and outperform competitors. Yet, translating data into actionable insight is a common hurdle. Traditional methods of data replication are often cumbersome and time-consuming, which makes informed decision-making and implementation slow and inefficient.
This is where business intelligence platforms like Power BI and Tableau come into play. Both are designed to simplify the complex data landscape, offering intuitive data visualization that transforms raw numbers into tangible, profit-driving actions.

Tableau’s Strengths:
- Real-time Data Handling: Tableau shines with its ability to manage vast datasets in real time, promoting swift analytics and unhindered data exploration.
- User-Friendly: With prebuilt industry dashboards, Tableau serves users across all sectors, regardless of their analytics proficiency.
- Versatile Data Integration: Tableau stands out in its ability to pull data from numerous sources, including Google Analytics, Cloudera, Salesforce, AWS, Dropbox, SQL Server, Oracle, Teradata, and more.
- Sharing & Collaboration: Whether on the cloud, on-premise, or hybrid, tools like Tableau Online and Tableau Server ensure analysts can share insights across devices and platforms.
- Top-tier Security: Tableau boasts enterprise-level security credentials, ensuring data integrity and safety.
PowerBI’s Advantages:
- Data Editing While Loading: Power BI offers a unique feature that allows data editing during the loading phase.
- User Assistance: Non-analysts might find Power BI easier to navigate, thanks to Cortana’s assistant, enabling users to ask business questions in natural language.
- Efficient Data Sharing: Through integration with Microsoft cloud solutions like Office 365, sharing insights is a breeze, whether with just one person or an entire team.
- Broad Data Source Compatibility: From simple Excel files to Azure databases, collaboration apps, Salesforce, MailChimp, Facebook, pdf, xml and others, Power BI integrates seamlessly.
- Robust Security: Power BI users can collaborate confidently, knowing that the platform maintains stringent data protection standards.
Who Should Use Which?
Academics & Libraries: Tableau is particularly beneficial for those in academic sectors needing to blend large data volumes. Researchers can instantly share information and collaborate with a wider audience using data visualization and dashboards, which leads to quick feedback and better results. Librarians can effectively present survey results with compelling visuals and readily share via their website and other channels.
Healthcare: Both Tableau and Power BI can drive analytics in healthcare, supporting better treatment planning and improved service quality. Both tools are HIPPA compliant, accelerate operational efficiencies and deliver faster analytics for treatment planning and clinical research.
Business Management: Businesses will find value in using any BI system to gain additional insights and empower quicker decision making for increased productivity and profitability. While Tableau excels in handling vast real-time data and connecting separate data warehouses, startups and small businesses might find Power BI’s cost-effective licensing appealing.
Education: Students and educators can leverage Tableau’s user-friendly interface to develop assignments and hone analytics skills. They will also find value in the vast capabilities of Tableau to analyze, visualize, and share amongst their communities, both locally and globally. Both groups may take advantage of the Tableau eLearning suite (web based training) with access to a free one-year trial license through their accredited institution.
Microsoft-Centric Organizations: Companies deeply integrated into the Microsoft ecosystem will find Power BI’s seamless compatibility with Azure, Teams, and SharePoint incredibly valuable. With Microsoft 365, these dashboards can be connected with Excel queries, reports and other data models. Team members will be familiar with the functionalities and will easily share information across the organization.
In Conclusion
While both Tableau and Power BI stand out in today’s BI software market, each of them has preferred use cases. Both platforms enhance teamwork and ensure secure, trustworthy environments for data, simplifying the entire data management process, from connection to actionable insights.
Tableau offers simplicity and scalability. Users can craft detailed visualizations using accessible statistical tools and machine learning capabilities. PowerBI is generally more cost effective and a simpler choice for smaller datasets and analytic requirements.
Ultimately, the choice between Tableau and Power BI boils down to an organization’s unique needs and preferences. Regardless of the choice, both tools are equipped to extract valuable insights from your data and enhance sharing and collaboration which helps ensure your relevance and competitiveness in the years to come.
[/fusion_text][fusion_text animation_direction=”left” animation_speed=”0.3″ animation_delay=”0″ hide_on_mobile=”small-visibility,medium-visibility,large-visibility” sticky_display=”normal,sticky”]
Curious to know more? Schedule a consultation with Thinklytics to know more about how data analytics can make your life easier and make you a hero at work.


