5 Best Online Courses for Learning Tableau

We offer a wide range of services to help you get the most out of Tableau. However, at Thinklytics, we also believe in educating potential clients. For us, there is no better business intelligence tool on the market than Tableau. The following corporations use it: Amazon Deloitte LinkedIn Walmart Tableau is especially heralded in the […]
What Are the Pros & Cons of Tableau?

One could argue that the process of data visualization has only gained the attention of most companies in recent times. Indeed, we only formed Thinklytics in 2018 after seeing the rising tide of Business Intelligence tools. We decided to focus on the platform Tableau because we genuinely feel it is the #1 data visualization tool. […]
Tableau Versus Power BI

Data visualization and analytics is huge business these days. Brands now fully understand the importance of gathering and analyzing data. The information gleaned from this process can cut costs, boost customer engagement, and increase profits. There are dozens of business intelligence tools, but consumers want a combination of ease of use, price, power, and brand […]
How to Successfully Implement Tableau’s Row-Level Security
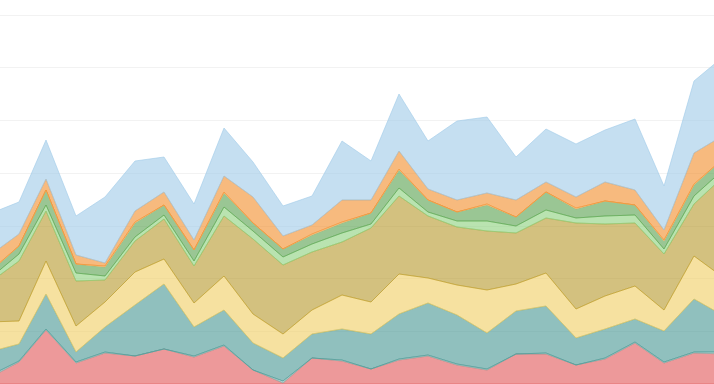
Published on March 8, 2017 by Chris Short, Senior Manager of HR Reporting and Analytics at Cox Enterprises. Article link I have been an avid user of Tableau for several years now, but their major upgrade to Tableau 10 has me super excited. You see, for a long time I have been struggling to find an extendable way to […]
Tableau Acquires ClearGraph: Database Talk! – Forbes
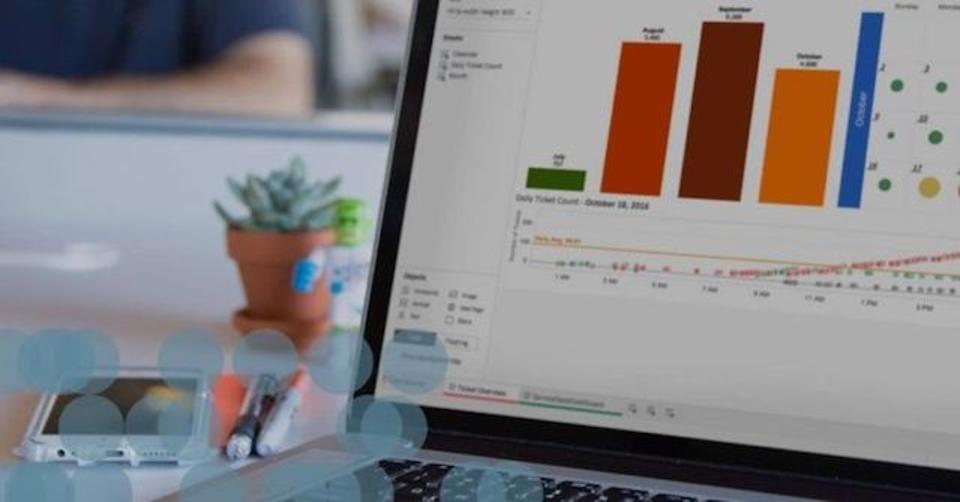
Simpler to use than database query language (and easier to look at too). Adrian Bridgwater , CONTRIBUTOR Data visualization company Tableau Software has acquired ClearGraph, a Palo Alto startup that produces what it calls ‘data discovery’ and analysis technology that works through spoken ‘natural language’ queries. There’s an almost mirror-like balance to what is going on […]
5 Expert Data Visualization Tips for SME Tools

NAZIRAH GARRISON MAY 10, 2016 Let’s talk about data—specifically visualizing your data in a way that unveils insight faster. You already know that using visualizations to communicate data is fast, easy, and efficient (pictures are so much easier to interpret than a crosstab full of numbers!). But you might be wondering how to communicate with […]


